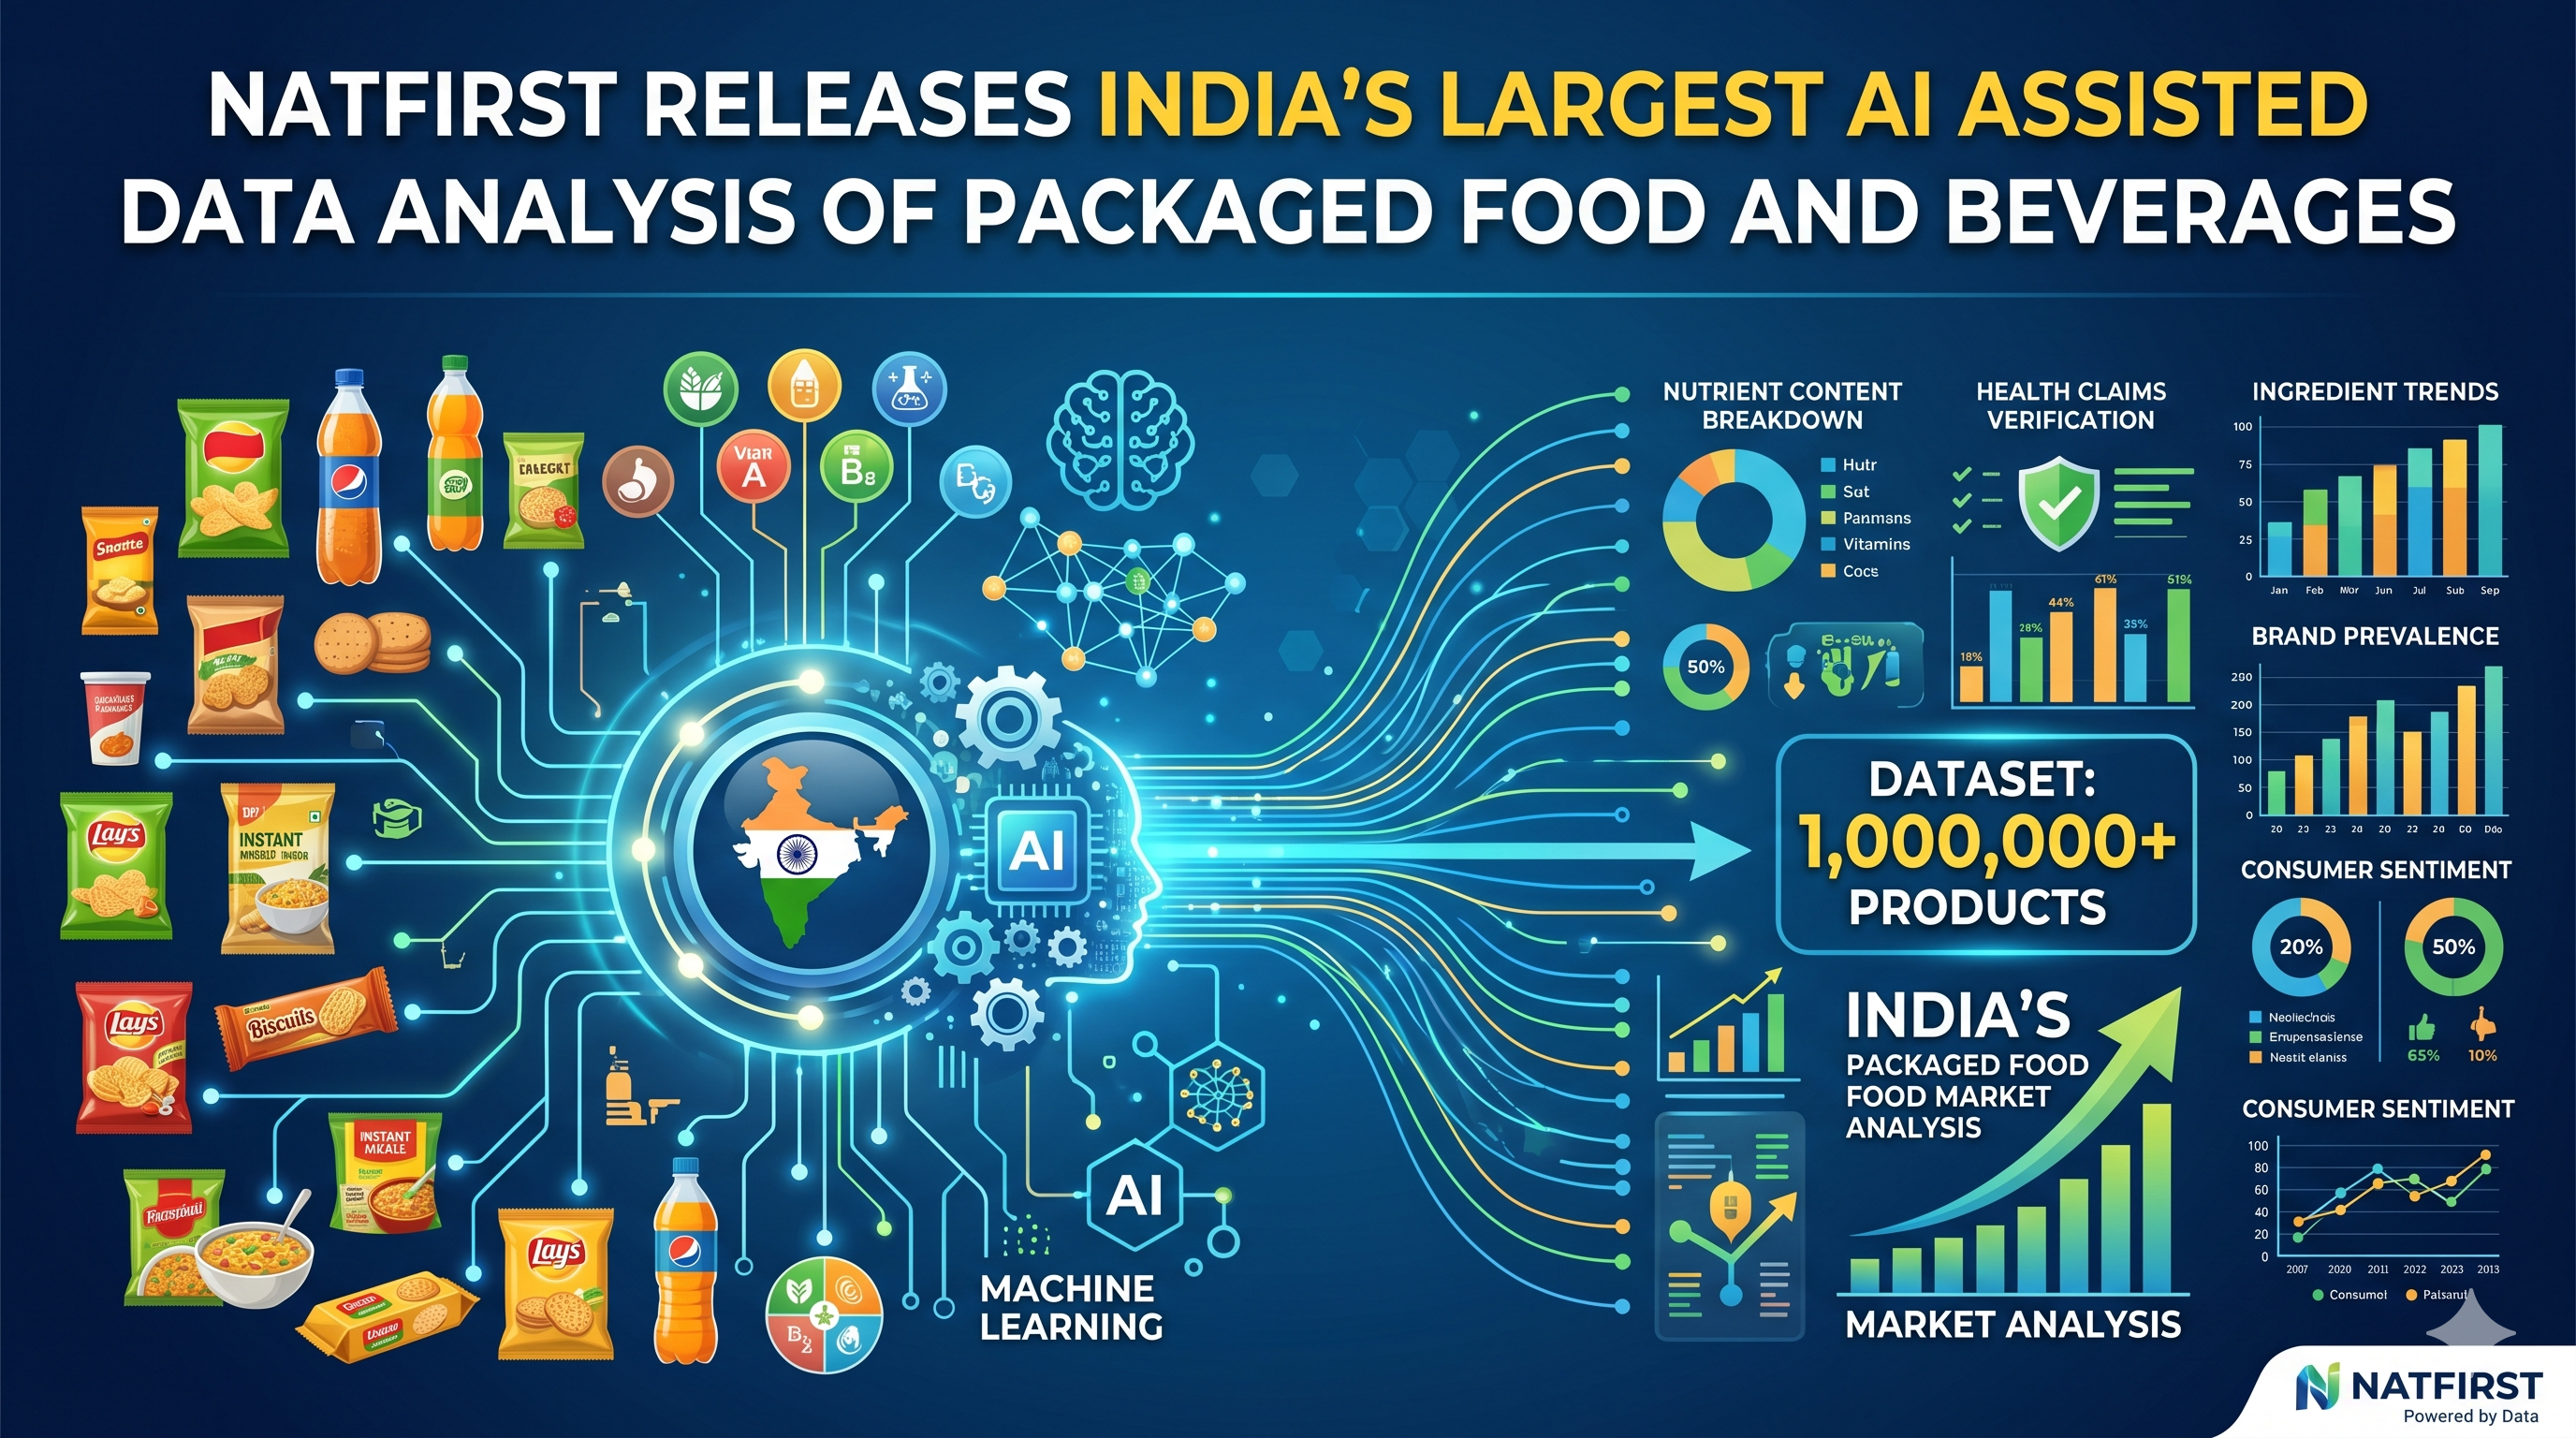
Natfirst Releases India’s Largest AI Assisted Data Analysis of Packaged Food and Beverages
~NatFirst releases India’s largest packaged food intelligence report, analysing more than 23,000 products across 25 plus categories, decoding the ingredients and nutrition levels of everyday packaged food and beverage products~
More than 80% of packaged biscuits and cookies in India contain palm oil and artificial flavours, according to a new AI-assisted analysis by NatFirst, a Hyderabad-based packaged food data infrastructure startup. The findings are from a first-of-its-kind initiative, part of India’s largest packaged food label analysis covering more than 23,000 products, crossing 1 lakh scanned product images across 25-plus categories and seven core food and beverage segments.
Across seven primary categories, NatFirst found that over 80% of biscuits and cookies contain palm oil and artificial flavours; 60–70% of sweetened breakfast products contain artificial additives; 80% of extruded snacks are high in sodium; approximately 80% of chocolates and desserts exceed added sugar thresholds and are high in saturated fat; 78% of ready-to-drink dairy beverages are high in added sugar; 98% of carbonated drinks contain artificial additives; and 90% of convenience meals are high in sodium, with 96% containing artificial additives.
The release of the report comes at a time when the packaged food and beverage market is growing exponentially and household food choices demand healthier alternatives. A study by the ICMR-National Institute of Nutrition showed that while 75.4% of consumers said they read food labels, only 14.7% actually read ingredient lists, while most focus on expiry dates (74.2%), brand names (60.9%), and manufacturing dates (57.7%).
The sentiment echoes the recent Economic Survey 2025-26, highlighting links between the rise of ultra-processed foods and India’s growing obesity burden, flagging aggressive marketing, especially to children and adolescents, as a key driver of consumption.
All the label data analysed was collected between January 2024 and November 2025, drawn from more than 1.3 million consumer-initiated product label scans, comprising a growing product library of over 60,000 SKUs. The TruthIn rating system follows a weighted model drawing data from three primary components, namely, Category-Specific Nutrition, Ingredient Quality, and Processing Levels, calculated as per FSSAI, ICMR-NIN, and WHO guidelines.
——————————————————————————————————————————————
For more specific information, refer to the Natfirst analysis here: https://www.reports.natfirst.com/ or refer to the annexure below, highlighting key data points.
*Disclaimer: The report covers data collected between January 2024 and November 2025. Analysis is based on declared nutritional information and ingredient lists analysed from labels or package-level data. It is not a lab audit, a consumption study, or a brand ranking tool.
——————————————————————————————————————————————————–
ANNEXURE 1:
Shifting household food spending
Evidence from the Household Consumption Expenditure Survey (HCES) 2022-23, as analysed by the Economic Advisory Council to the Prime Minister (EAC-PM), shows a significant decline in per-capita cereal consumption, a key indicator of traditional home-cooked diets. Concurrently, processed packaged foods and beverages now account for the highest share within food expenditure: 9.84% of Monthly Per Capita Expenditure (MPCE) in rural households and 11.09% in urban households.
Segment 1(Biscuits & Cookies) Products analysed: 2,112 | Average TruthIn Rating: 0.7 to 1.9
Despite being one of the most widely consumed packaged food categories, biscuits rank among the weakest in nutritional balance. Average TruthIn ratings for dominant formats fall below 1.0, indicating the challenge is systemic, not a matter of outlier products. Sub-category ratings range from 0.7-0.8 for sandwich biscuits and filled biscuits to 1.9 for digestive/high-fibre biscuits.
Key findings:
- More than 80% of products contain palm oil and artificial flavours
- Approximately 75% are made with refined flour
- More than 80% exceed added sugar thresholds
- Sandwich biscuits: 88% high in added sugar, 99% high in saturated fat, 100% contain additives, 92% contain artificial flavours
- Filled biscuits: 87% high in added sugar, 95% high in saturated fat, 99% contain additives, 97% artificial flavours
- Digestive biscuits: 88% exceed added sugar thresholds, 94% are high in saturated fat, though over 80% qualify as high in dietary fibre and nearly 60% contain moderate protein
Segment 2 (Breakfast & Spreads): Products analysed: 2,122 | Average TruthIn Rating: 2.2 to 3.8
This segment stands out for strong positive nutritional attributes. Most products contain moderate to high protein and dietary fibre. However, high saturated fat, added sugars, and artificial additives often dilute the benefits of protein and fibre. Products relying on simple, unsweetened ingredients perform significantly better. Sub-category ratings ranges from 2.2-2.4 for sweetened nut butters and sweetened ready-to-eat cereals, to 3.5 for instant quick cooking oats.
Key findings:
- 60-70% of sweetened products contain artificial additives
- More than 40% of RTE cereals contain artificial flavours
- Sweetened nut butters: 93% high in saturated fat, 64% contain artificial additives
- Unsweetened nut butters: 0% added sugar, 99% high in protein, only 6% contain artificial additives
- Instant oats: only 5% high in added sugar, 97% are a rich source of fibre
Segment 3 (Munchies & Savoury Snacks) Products analysed: 9,070 | Average TruthIn Rating: 2.2 to 3.0
Munchies represent a routine savoury habit where nutritional risks are structural and often overlooked. The formulation profile is built around salt, saturated fat, and complex seasoning systems. Most formats fall into Average to Weak rating bands. While extruded snacks and packaged chips got an average TruthIn rating of 2.2-2.3, Salted Dry Fruits, Nuts & Seeds were rated 3.0.
Key findings:
- 80% of extruded snacks are high in sodium
- Approximately 75% exceed saturated fat limits
- Approximately 50% contain palm oil
- 62% of chips and extruded snacks contain artificial additives
- Salted dry fruits, nuts and seeds: 92% high in protein, 49% a rich source of fibre, but 47% remain high in sodium
- Indian savouries: 70% high in sodium, 82% high in saturated fat, 64% contain palm oil
Segment 4 (Chocolates & Desserts) Products analysed: 4,436 | Average TruthIn Rating: 1.0 to 2.0
Sugar and saturated fat form the core of how these products are made. All sub-categories fall into lower TruthIn rating bands. Positive nutritional elements are very low. Fewer than 15% of products provide a good source of dietary fibre, and protein is generally incidental. Sub-category ratings include Frozen Desserts, Cakes, Pastries and Pies and ice-creams between 1 and 1.1, Milk Chocolates got an Average TruthIn Rating of 1.9 and traditional Indian sweets a 2.0.
Key findings:
- Approximately 70% of products exceed total sugar limits
- Approximately 80% exceed added sugar thresholds and are high in saturated fat
- Ice creams: 83% high in added sugar, 90% high in saturated fat, 94% contain artificial additives
- Milk chocolates: 89% high in total sugar, 87% high in added sugar, 94% high in saturated fat
- Cakes, pastries and pies: 97% contain artificial additives, 77% high in saturated fat
- Traditional Indian sweets: 79% high in total sugar, 74% high in added sugar
Segment 5 (Dairy & Ready To Drink Beverages): Products analysed: 3,192 | Average TruthIn Rating: 1.6 to 3.8
This segment shows clearly how processing intensity affects nutritional quality. Core dairy products built around natural ingredients contrast sharply with RTD dairy beverages, which rely on added sugars, flavours, and additives. Plain milk (3.8) and yogurt (3.5) highlight dairy’s natural strength, while RTD beverages (1.6) behave more like sweetened beverages with protein.
Key findings:
- Approximately 50% of products exceed saturated fat limits (natural dairy fat)
- Approximately 20% contain added sugars, mainly RTD beverages
- Approximately 33% contain artificial additives
- RTD dairy-based drinks: 78% high in added sugar, 88% contain artificial additives, 76% artificial flavours, 40% artificial colours
- Plain milk: 0% high in added sugar, 7% contain artificial additives
- Cheese: 84% high in protein, 91% high in saturated fat
Segment 6 (Cold Drinks): Products analysed: 2,139 | Average TruthIn Rating: 1.2 to 1.5
The cold drinks segment sits at the lower end of nutritional performance. These products are built mainly around added sugar and additive systems rather than ingredients that naturally provide nutrition. High in calories but low in nutritional value, with little to no protein or fibre. Regular Carbonated Drinks were rated 1.2 on average and Fruit Juices / Drinks (less than 100% juice) a 1.5.
Key findings:
- Approximately 98% of carbonated drinks contain artificial additives
- 58% of carbonated drinks contain artificial colours
- Regular carbonated drinks: 63% high in added sugar, 64% artificial flavours, 66% artificial colours
- Fruit juices / drinks (less than 100% juice): 65% high in added sugar, 94% contain artificial additives, 80% artificial flavours
- Only 4% of fruit juices provide a good source of fibre
- Neither sub-category contains any products with meaningful protein or fibre
Segment 7 (Convenience Meals) Products analysed: 625 | Average TruthIn Rating: 1.5
Flavoured instant noodles and pasta is considered separately because of the meal format it represents and its role as a quick hunger solution. This category was among the first packaged foods to enter Indian kitchens and is expected to continue high growth at an estimated 13.18% CAGR through 2026-2033. Average TruthIn Rating was 1.5.
Key findings:
- 90% are high in sodium
- 75% are high in saturated fat
- 64% contain refined flour as the base
- 96% contain artificial additives
- 82% contain palm oil
- 60% contain artificial flavours
- 88% contain moderate protein, but 32% provide a good source of fibre


Post Comment